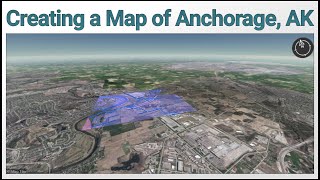
Creating a Map of Anchorage, Alaska in Equator
Creating a Map of Anchorage, Alaska in Equator
 ****The Equator user interface has been updated.*****
Tutorial on new Equator user interface: https://youtu.be/USpCpwSPbp8
Try Now: https://maps.equatorstudios.com/?entry=topography
In this video, we show you how to create a custom map using Anchorage, Alaska as an example. We cover adding data, editing data, bringing in a point cloud and contours.
If you liked this video, check out this one on how to make a city map poster using Equator + Canva:
Keywords: lidar, contours, mapping, point cloud, equator
Music: Once Again by Benjamin Tissot
https://www.bensound.com/
_________________________________________________________________________________________________
Transcript:
00:00
Hi, my name is RJ and I’m going to be showing you how to make a custom map in Equator. First thing I did was make a new project. Now I’m going to select a location. Start by searching Anchorage and zooming into Anchorage, Alaska. Now I’ll zoom in more to get a better base layer, then switch over to layers. Delete my original search and open up the filter to make sure I’m only getting the Municipality of Anchorage. Now let’s add some data. Grab airports. See them load in right away. Subdivisions. Addresses. There is the subdivisions loading in. Now let’s look for the streets. Now the streets are loading in. Now we’re just waiting for the addresses to load in. It should only take a moment.
01:20
Now, it’s not looking as good as it could so I’m going to have to go in and make some edits. First, I’m seeing these black lines around these squares. After removing them I think it looks better with them there, so I’ll leave them. These address points definitely need to be smaller. Let’s try 1 pixel. Looking good. We can make these streets thicker. But, when we’re zoomed out it might be too much. Let’s leave them at 1 pixel. But, the addresses can come up to 2 pixels. That looks better.
02:15
Now, let’s add some data. First, I’m going to check the LiDAR availability. We see a green box, that means we have high quality LiDAR here. Click on contours and create a new site. It will take 5 minutes to process so in the meantime lets look for a place in the mountains to generate a point cloud. We have high quality data all the way out to here, so lets make a new site. Zoom in to get a better base map. And select point cloud. This one will load in immediately. Give that some time to load in, and in the meantime lets get rid of the red box around it. Rename the group to pointcloud just to stay organized. Lets take a look. Point cloud is looking good. Little bit of noise on the left hand side there. Other than that it looks great. Zoom in. We see detailed trees. We can tell the elevation difference based on the colors. Great.
04:00
Let’s look at the rest of the data we have here from this angle. We see the streets are orange, the dots are the addresses.
04:18
Now we’ll see the contours in the overview here.
When I try to get a heightmap from an area sometimes it comes out stretched and the land is warped how can I fix that